Calibration
with a scintillator
|
| In
this case a scintillation detector is inserted into the beam in the
target area in addition to the SEETRAM. The scintillation detector is
much thicker than the SEETRAM detector and is therefore only inserted
during the calibration procedure. |
| The
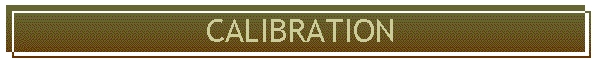
Figure 1 show the counting rate measured by the scintillator (SCI) and
the SEETRAM as a function of time for a Pb beam at 500 AMeV. The spill
structure of the beam is to be recognize in both part of the figure. In
the analysis of the data the number of particles measured by the SCI are
integrated over one spill as well as the number of SEETRAM counts inside
the same spill. |
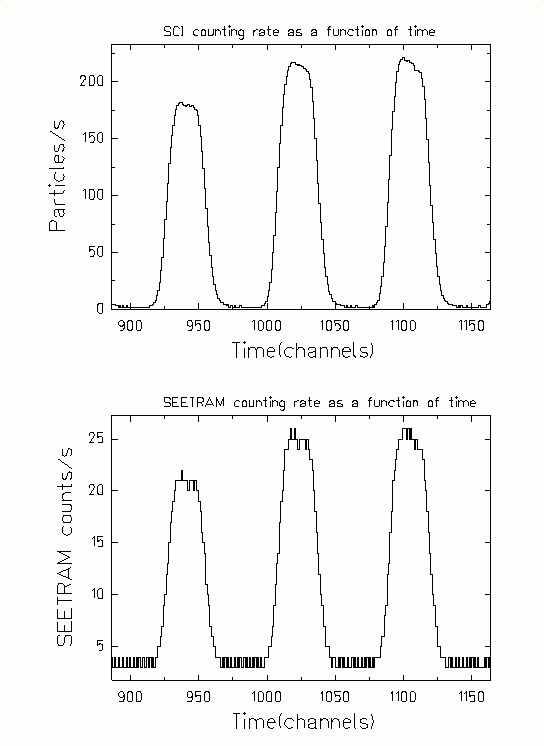 |
Figure 1.
Counting rate measured by the scintillator SCI01 (upper part) and
SEETRAM (lower part) as a function of time for a lead beam at 500 AMeV. |
| Plotting
the number of particles inside the spills against the corresponding
SEETRAM counts and making a linear fit, Figure 2, the SEETRAM
calibration factor is obtained. Nevertheless, the response of the SCI
depends strongly on the beam intensity and for fast particle
counting up to counting rates of 106 per second saturation
effects in the SCI start to be remarkable.
|
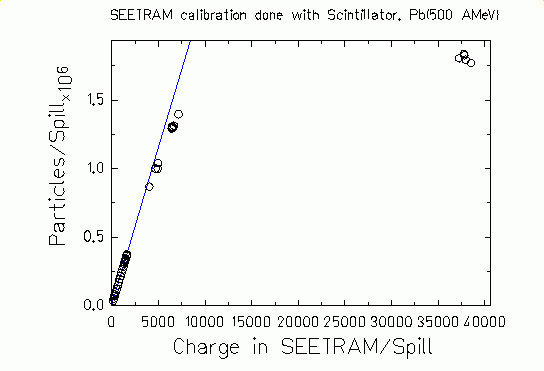 |
Figure 2.
Number of particles inside the spills measured with SCI01 as a function
of the corresponding SEETRAM counts (open dots). Blue line represents
the linear fit to data that gives the SEETRAM calibration factor. |
|
As a consequence, the overlap region
where it is possible to count the particles with the scintillator and to
determine the SEETRAM current is rather small. The sensitivity limit of
the SEETRAM (about 10-12 As = 6.25 106 e)
corresponds to 3 104 uranium projectiles or 7.8 105
argon projectiles. Another drawback of using the SCI for the SEETRAM
calibration is that its light output suffers from radiation damages, and
must be renewed from time to time. |
|
| Calibration
with an ionisation chamber (IC) |
| To
replace the scintillation detector, an IC has been used as an
alternative detector for the SEETRAM calibration . It does not show any
radiation damages. The anode of the ionisation chamber is connected to a
preamplifier by a capacity and to a current digitiser by a resistance.
The signals of the preamplifier are fed into an amplifier and counted
with the help of a discriminator and a scaler. In this way the IC is
applied simultaneously for counting single particles, and for measuring
the ionisation current induced in the counting gas.
|
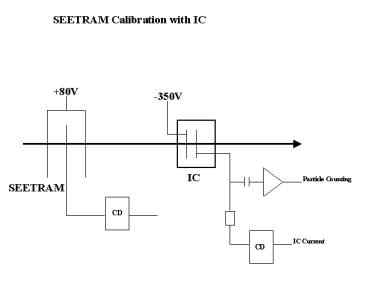 |
Figure 3.
SEETRAM calibration with an ionisation chamber (IC). IC can be used for
measuring the ionisation current induced by the passage of a beam and
for counting single particles. |
|
The SEETRAM calibration is performed in
two steps. First, the current in the ionisation chamber is calibrated by
a particle counting. Secondly, the SEETRAM current is calibrated with
respect to the ionisation current. The Figure 4 shows the particle
counting rate measured by the IC (upper part) and the current due to the
passage of Pb ions through the IC (lower part) as a function of time. |
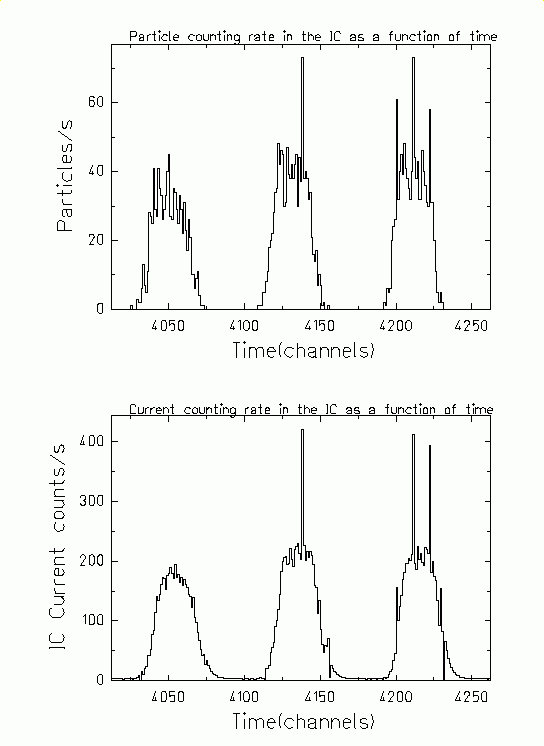 |
Figure 4.
As a function of time are shown the particle counting rate (upper part)
and the current induced by the passage of 500 AMeV lead ions (lower
part) through the IC. |
|
By integrating over the spills and
making a linear fit on the two quantities, the first calibration factor
is obtained. By doing the same operations with the spills corresponding
to the current in the IC and the current in the SEETRAM (see Figure 5)
the second calibration factor is determined. A suitable combination of
the two factors gives the SEETRAM calibration constant. |
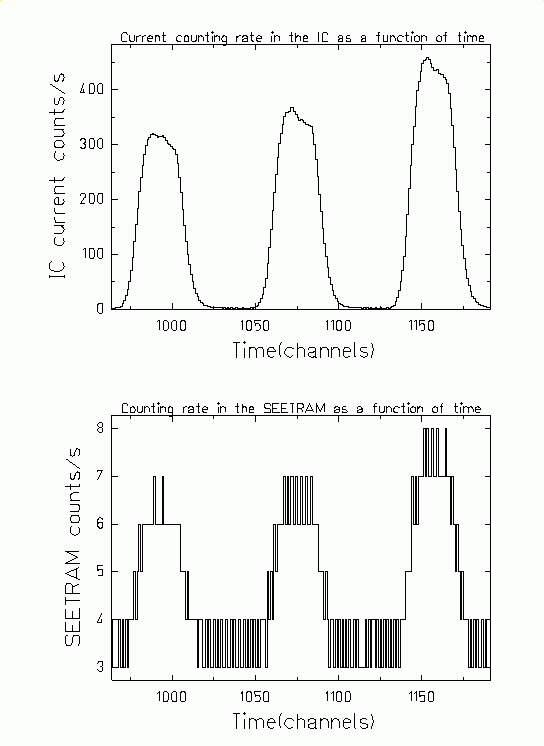 |
Figure 5. Current
counting rate in the IC (upper part) and the counting rate in the
SEETRAM (lower part) as a function of time. |
|
The first step of the calibration is
limited by counting losses due to pile up but particle counting up to 105
per second is possible. Therefore the first calibration must be
performed at low beam intensities.
|
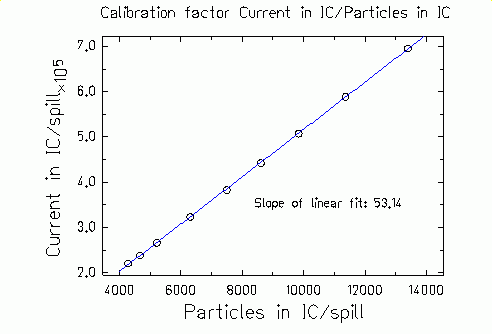
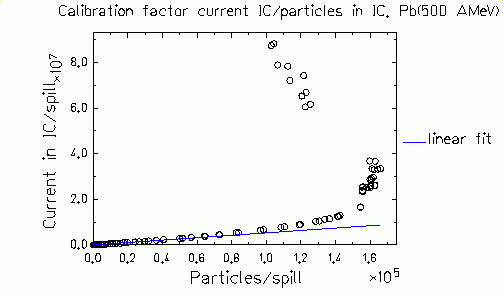 |
Figure 6.
Open dots - induced current in the IC vs. number of particles in a given
spill (also measured by the IC). Blue line - linear fit to the measured
data resulting in a calibration factor current IC / particles IC. |
|
The second calibration is
influenced by recombination losses of the ionisation current.
Recombination is proportional to the product of the density of ions and
the density of electrons inside the chamber. Since each of them is
proportional to the beam intensity recombination effects can be
considered in the analysis by fitting a second-order polynomial to the
ionisation current as a function of the SEETRAM current. The calibration
factor is given by the linear coefficient of the fit. As we can see in
the Figure 7, the parabolic fit works only in the lowest range of
intensity.
|
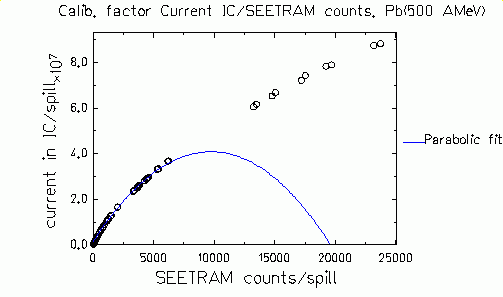 |
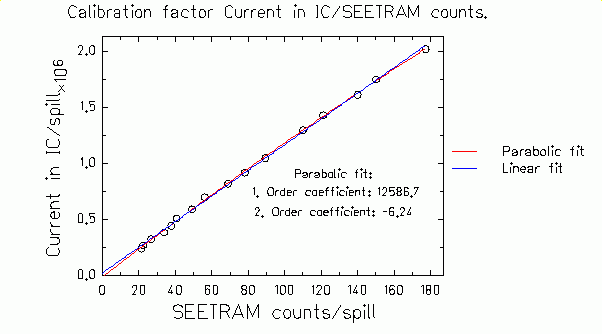
Figure 7.
Open dots - current induced in the IC vs. number f counts in the
SEETRAM. Blue line - parabolic fit to these data. |
|
The two steps of the calibration for Pb
ions at 500 AMeV can be seen in the Figure 8:
|
|
Figure 8.
Two steps SEETRAM calibration with a ionisation chamber. |
|
The quotient of the
slope of the linear fit of the first figure and the first order
coefficient of the parabolic fit give a SEETRAM calibration constant of
237 Pb ions/SEETRAM count. For the same projectile, the ionisation
current is about 1000 times higher than the SEETRAM current. Therefore,
the overlap regions for the two calibrations are quite large. |
|
| Noise |
|
There are two sources of
noise: statistical noise and periodic electric fields of accelerator
components. Current measurement and particle counting are influenced by
noise in different ways. Since there is no galvanic connection, the
integrated currents from SEETRAM and ionisation chamber are not
disturbed by any noise. However, the function of the current digitiser
may be disturbed if the first stages saturate. Since all noise signals
are bipolar, it is important to tune the offset of the current
digitizers high enough to ensure that the digital outputs of the current
digitisers never stop. If this happens, any information on the magnitude
of the current during this time is lost! In particular, strong bipolar
noise signals have been observed at the beginning and at the end of the
extraction cycle.
In particle counting, any noise signal may erroneously be interpreted as
a particle. Therefore the noise signals, both statistical and periodic,
must be considerably smaller than the particle signals. In order to
avoid periodic noise, ground loops should be avoided and the detectors
should be properly shielded.
In the analysis of the data the positive offset of the Current Digitiser
must be accurately subtracted before integrating over the spills.
|
Operation
limits of both calibration methods
|
|
As it has been shown
before, the detectors involved in the calibration depend strongly on the
beam intensity. All detectors must be operated in an intensity range in
which its behaviour is well known in order to avoid important
systematic errors.
The SCI works well up to counting rates around 105 particles
per second where saturation effects start to be remarkable. The particle
counting of the IC is as well limited due to pile up in the
preamplifier.
On the other hand, the current produced in both the SEETRAM and the IC
must be higher than 10-12 Ampere in order to distinguish the
signals from the positive offset of the Current Digitizer.
Finally, recombination effects in the IC cannot be described by a
parabolic fit for high intensities.
The limits of operation we recommend for the two calibration methods are
displayed in the next table: |
|
DETECTOR
PROPERTY
|
LOWER LIMIT
|
EFFECT
|
UPPER LIMIT
|
EFFECT
|
| SCI
particle counting |
NO! |
|
105/s |
Saturation < 1% |
| IC
particle counting |
NO! |
|
104/s |
Pile up < 1% |
| IC
current |
10-12A |
Offset
uncertainty <1% |
10-7A |
Recombination
losses < 10% |
| SEETRAM
current |
10-12A |
Offset
uncertainty <1% |
NO!! |
|
| The
last considerations are graphically represented for different ions in
the Figure 9.
|
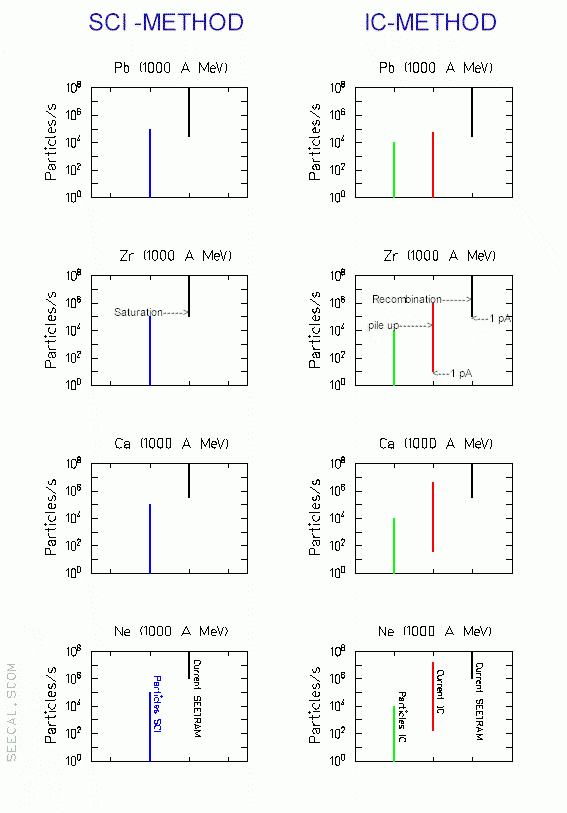 |
Figure 9.
Operational limits of the SCI (left) and the IC (right) calibration
methods. Different lines represent the regions of applicability of
different methods: black line - SEETRAM current, blue line - particles
counting by SCI, green line - particles counting by IC, red line -
current measured by IC. |
|
The calibration
constants for Zr, Ca and Ne were taken from Brohm's
model. In all cases a SEETRAM sensitivity of 10-10 is
assumed.
The figures in the left side correspond to the SCI calibration method.
The blue line represents the region of applicability of the SCI and the
black one the region of applicability of the SEETRAM in terms of
counting rates. For heavy ions like Pb, the operation ranges of both
detectors overlap. However, for lower charges the overlapping region
decreases, since the intensity needed to produce a secondary electron
current that overcomes the sensitivity limit ( 10-12 Ampere)
increases. The limit case occurs for Zr, for lighter ions like Ca and Ne
there is no overlapping and this method is not longer applicable with
the desired accuracy.
In the right column are the figures related to the IC method. The green
and the red line represent the range of applicability of the particle
counting and the current digitizer of the IC respectively. The range of
applicability of the SEETRAM is like before represented in black. The
ionisation current has a large dynamic range which widely overlaps with
the sensitivity range of the SEETRAM. However, depending on the size of
the ionization chamber and the counting gas, particle counting is
not possible for very light ions below Z=10 since the pulses of
the single ions cannot be resolved from the background in the
preamplifier. Nevertheless in this case one still could do the
calibration by combining the two detectors SCI and IC, using the SCI for
the particle counting.
|
| Trigger
conditions for the calibration |
| During
the intensity calibration of the SEETRAM, all relevant signals are
registered by scalers. In order to write the status of the scalers in
periodic intervals on tape, the data acquisition is triggered by a
clock, 1 Hertz or 10 Hertz. A 1 Hertz clock should also be used as an
additional trigger, also during the normal measurements, in order to
regularly read the scalers, also during beam pauses.
|
Measurement
of the extraction efficiency of SIS for Pb-beam at different energies
|
|
In April '99 the SEETRAM
was calibrated for Pb ions at 250, 500 and 1000 AMeV and the extraction
efficiency of SIS was measured.
At 500 MeV the calibration was done with both calibration methods. The
SCI method gave a value of 231 Pb ions/SEETRAM count for the calibration
constant and the IC method 237 Pb ions/SEETRAM count. Both results are
inside the error limits if we assume an statistic error of 2%, which is
the accuracy needed for precise cross section measurements.
Once the SEETRAM is calibrated we can determine beam intensity. By
comparing it with the current measured inside SIS we obtain the
extraction efficiency. The procedure is shown for Pb ions at 500 AMeV in
the Figure 10.
|
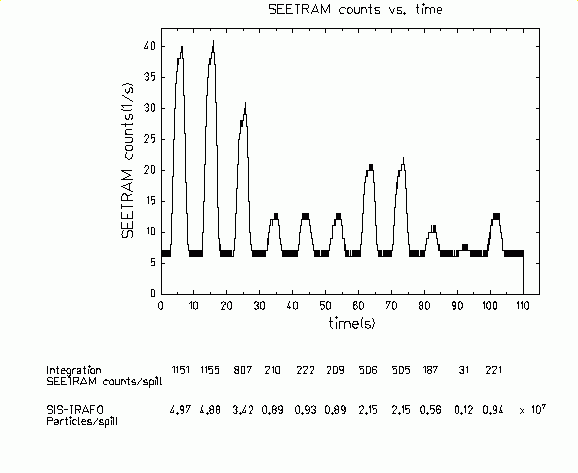 |
Figure 10.
Different accelerator spills measured by the SEETRAM for different
intensities as a function of time. |
|
Figure 10 shows different accelerator
spills measured by the SEETRAM for different intensities as a function
of time. The first horizontal line gives the number of the SEETRAM
counts inside the spills, the second horizontal line gives the number of
Pb ions measured in SIS for the same spills. The Figure 11 represents
these quantities (the SEETRAM counts are transformed into the absolute
intensity). The slope of the linear fit gives an extraction efficiency
of approximately 73%.
|
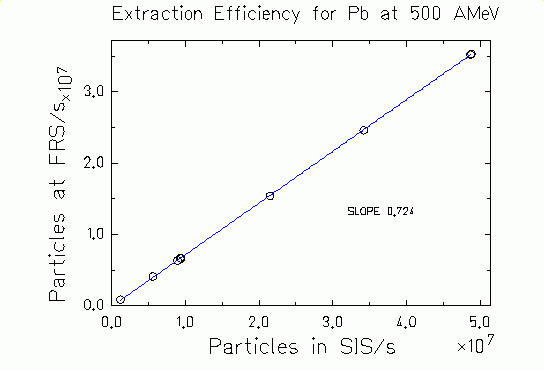 |
Figure 11.
Number of particles measured at the target area of FRS vs. number of
particles measured in SIS (open dots). Linear fit to these data (blue
line) gives the extraction efficiency. |
|
The following table sumarizes the
results of these measurements. In all cases the SEETRAM sensitivity was
set to 10-10: |
| ENERGY |
CALIBRATION METHOD
|
CALIBRATION
FACTOR |
EXTRACTION EFFICIENCY |
COMMENTS |
| 250 AMeV |
SCI |
162 Pb ions/SEETRAM
count |
65% |
Spill
length~1s |
| 250 AMeV |
SCI |
168 Pb ions/SEETRAM
count |
67% |
Spill
length~5s |
| 250 AMeV |
SCI |
168 Pb ions/SEETRAM
count |
76% |
New
extraction setup |
| 500 AMeV |
SCI |
231 Pb ions/SEETRAM
count |
73% |
|
| 500 AMeV |
IC |
237 Pb ions/SEETRAM
count |
75% |
|
| 1000 AMeV |
SCI |
307 Pb ions/SEETRAM
count |
72% |
|
|
|
In general the
extraction efficiency of SIS rounds 70%.
For these data we assume
an statistical error of 2%. The possibility of additional systematic
errors must be considered as well. Figure 12 represents in detail the
lowest intensity range of the current in the IC as a function of the
number of particles in the IC. These data were measured for two
different sensitivities 10-9and 10-10. To plot
them together the values of the ionisation current taken at 10-9sensitivity
were multiplied by factor 10. The figure shows that there is a clear
discontinuity in the transition from one sensitivity to the next which
might be due to a wrong sensitivity adjustment of the current digitizer.
|
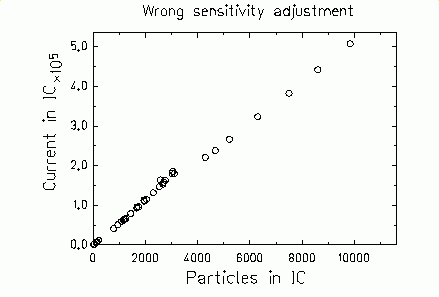 |
Figure 12.
Effect of a wrong sensitivity adjustment. |
|
| Comparison
with theoretical predictions |
|
Based on experimental
data measured at 1000 MeV Brohm et al. developed a model
which predicts the secondary electron yield for all energies and ion
species.
In the figure 13, the number of secondary electrons produced in the
SEETRAM by Pb ions at different energies that follow from our
calibration (black dots, left scale) are represented along with the
theoretical predictions made by Brohm (white dots, left scale).
Experimental and theoretical data agree very well for high energies but
differ as decreasing the energy of the projectiles. In addition the
energy loss of the ions in the SEETRAM is represented (triangles, right
scale). The effects of the velocity of the ion seem not to be well
reproduced by Brohm's model.
|
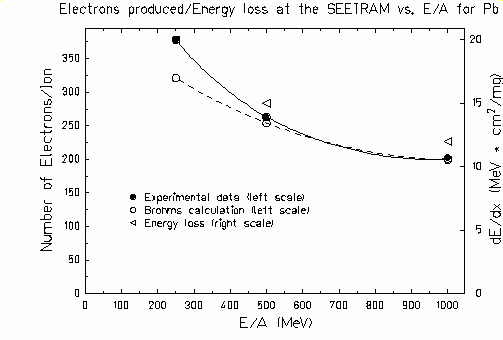 |
Figure 13.
Number of secondary electrons produced in the SEETRAM by a passage of
lead ions as a function of the beam energy. Full dots and open dots
(left scale) represent measured and calculated data, respectively. Open
triangles (right scale) show the energy loss of the ions in the SEETRAM. |
|